

This digital work is a part of a project for the University IUAV of Venice in 2015.
The developer Andrea Fasolo Rao and the designers Riccardo Gioria and I developed an interactive data visualization based on the IUCN Red List about the animal extinction where the navigation happens through the leap motion technology.
The concept of the whole project (digital and print) was made by all three of us and I was the Lead designer of the complete work.

HOW DOES IT WORK?
Inside a virtual tridimensional space, there are 14448 endangered animal species (IUCN Red List) each one represented by a geometrical shape. You can navigate using both the mouse and the Leap Motion controller and the deepest you go into the visualization, worst is the situation for the species. Indeed, along the X and Y axes they are ordered alphabetically, while the Z axis maps the status of the animals. This is accompanied by an audio generated in real time where the density of notes depends on the number of animal species the user is viewing.
Inside a virtual tridimensional space, there are 14448 endangered animal species (IUCN Red List) each one represented by a geometrical shape. You can navigate using both the mouse and the Leap Motion controller and the deepest you go into the visualization, worst is the situation for the species. Indeed, along the X and Y axes they are ordered alphabetically, while the Z axis maps the status of the animals. This is accompanied by an audio generated in real time where the density of notes depends on the number of animal species the user is viewing.
Featured on the Leap Motion official blog: On the Verge of Extinction
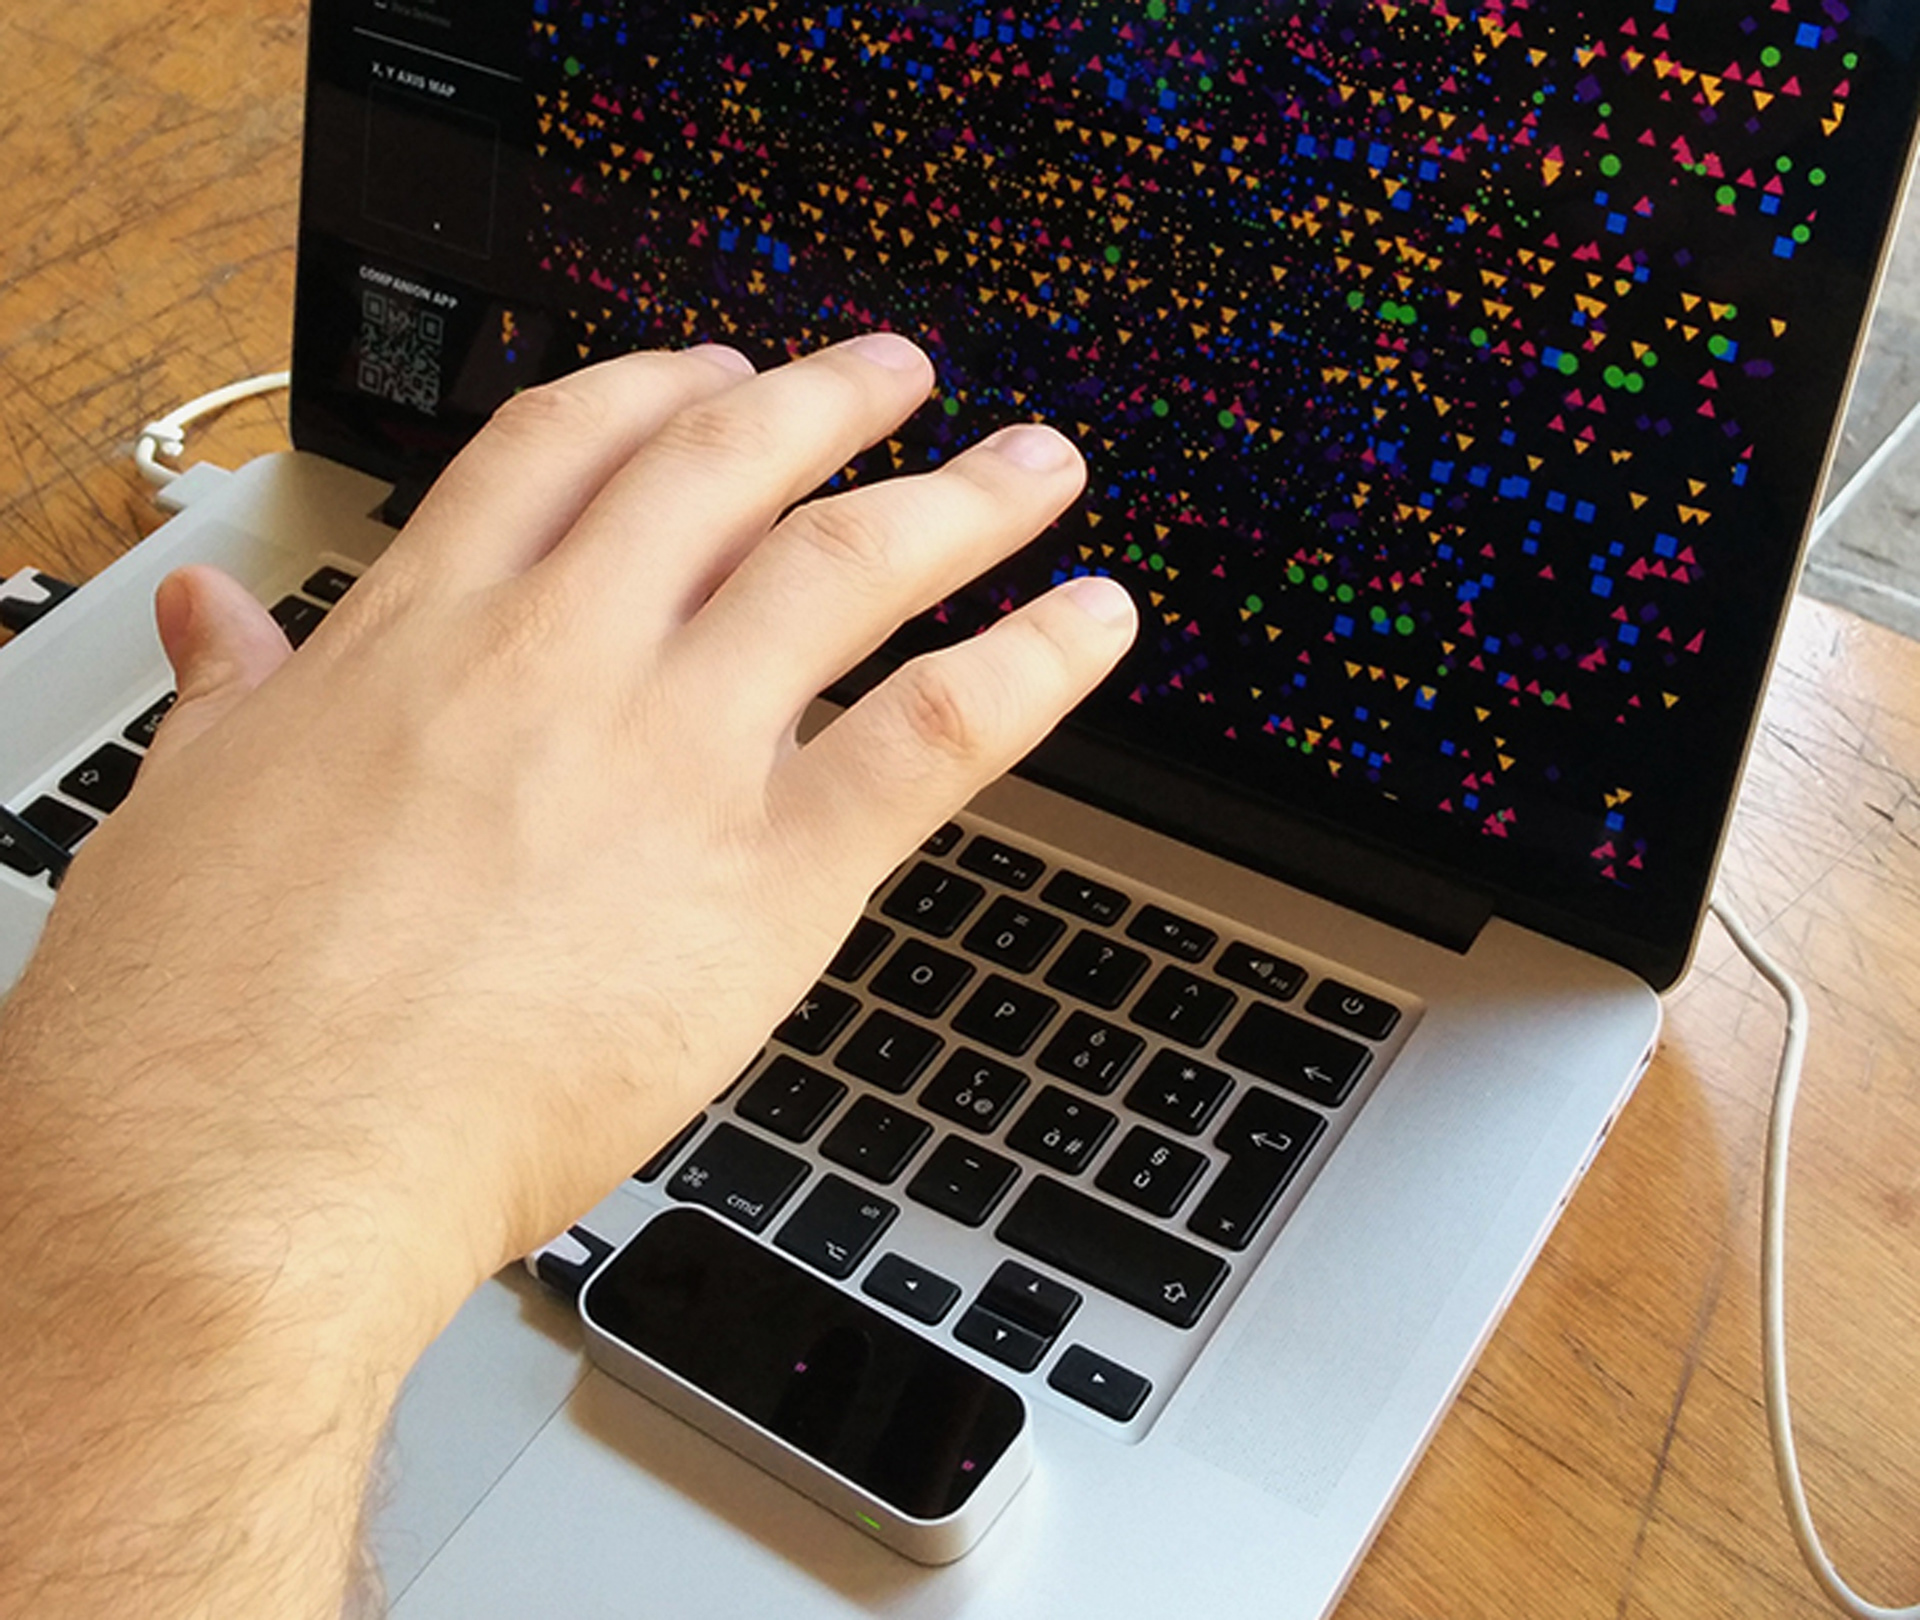

In order to get more information about the animals, there are two possible ways based on the device used to navigate.
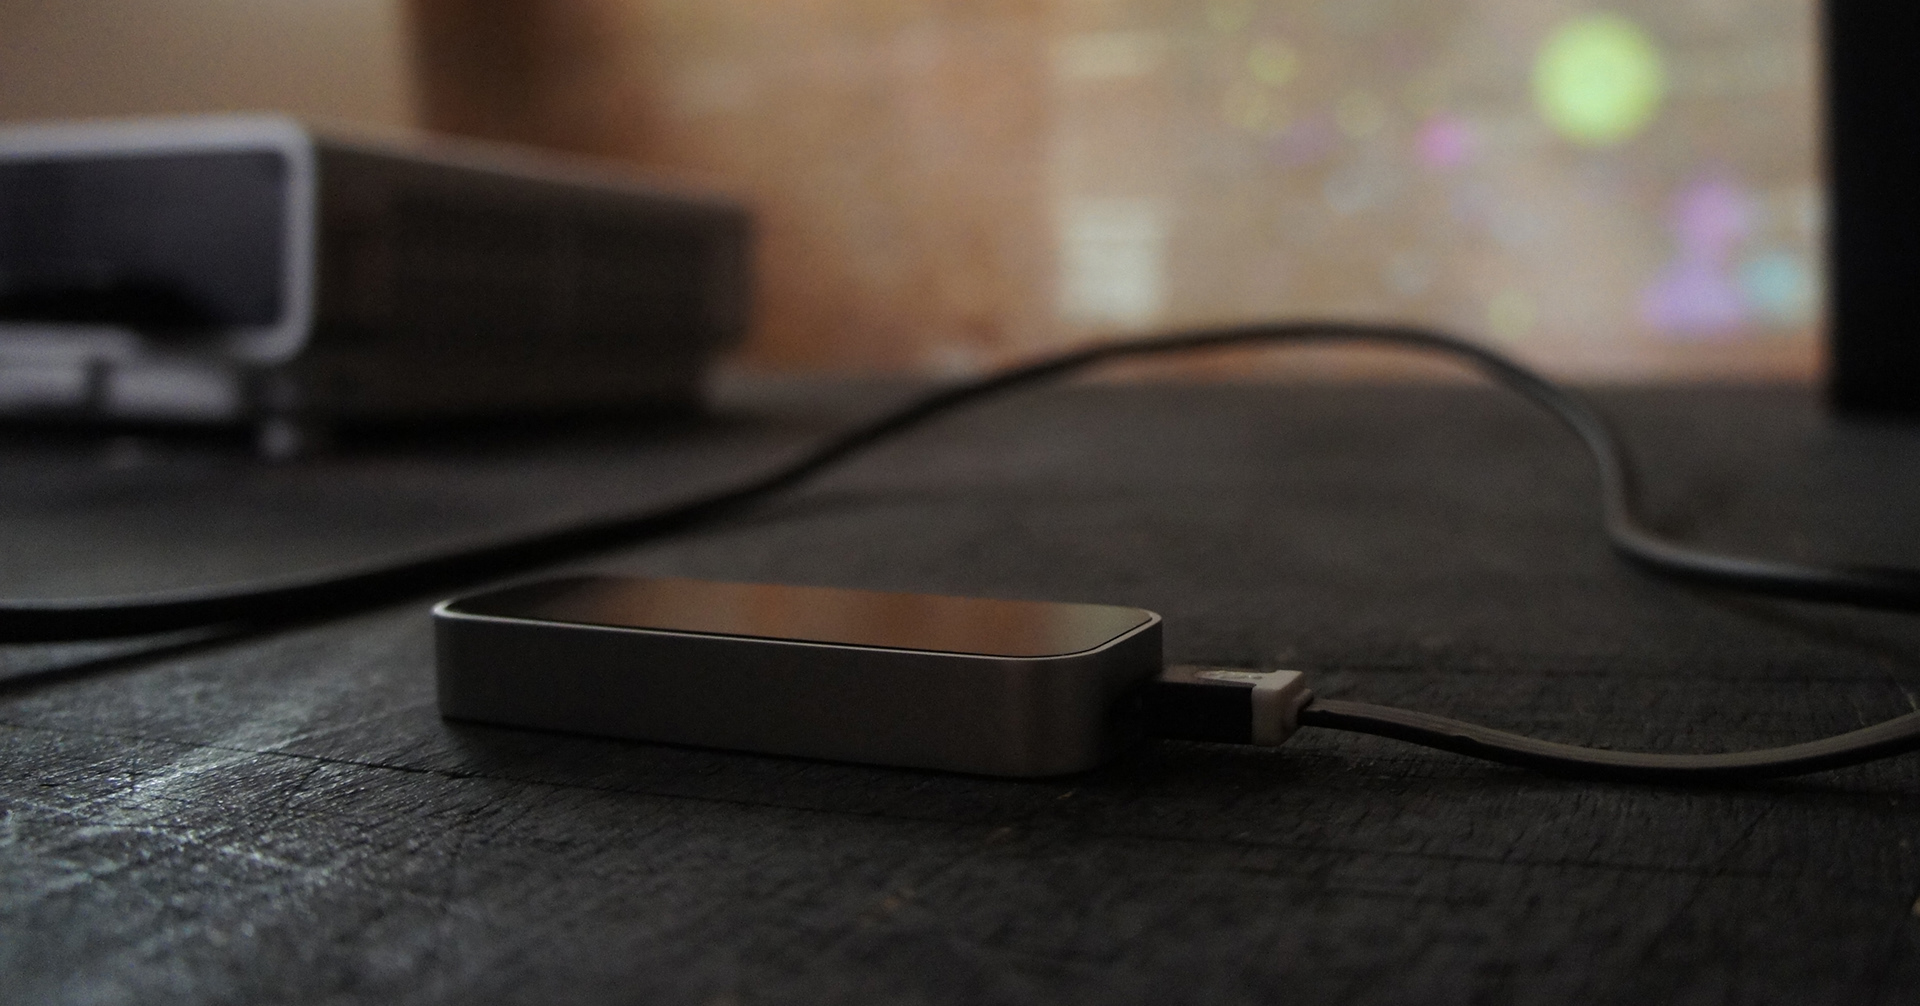
In case the navigation happens through the Leap Motion, a Qr-code on the bottom left of the interface give you access to a mobile app with the in-deep information.
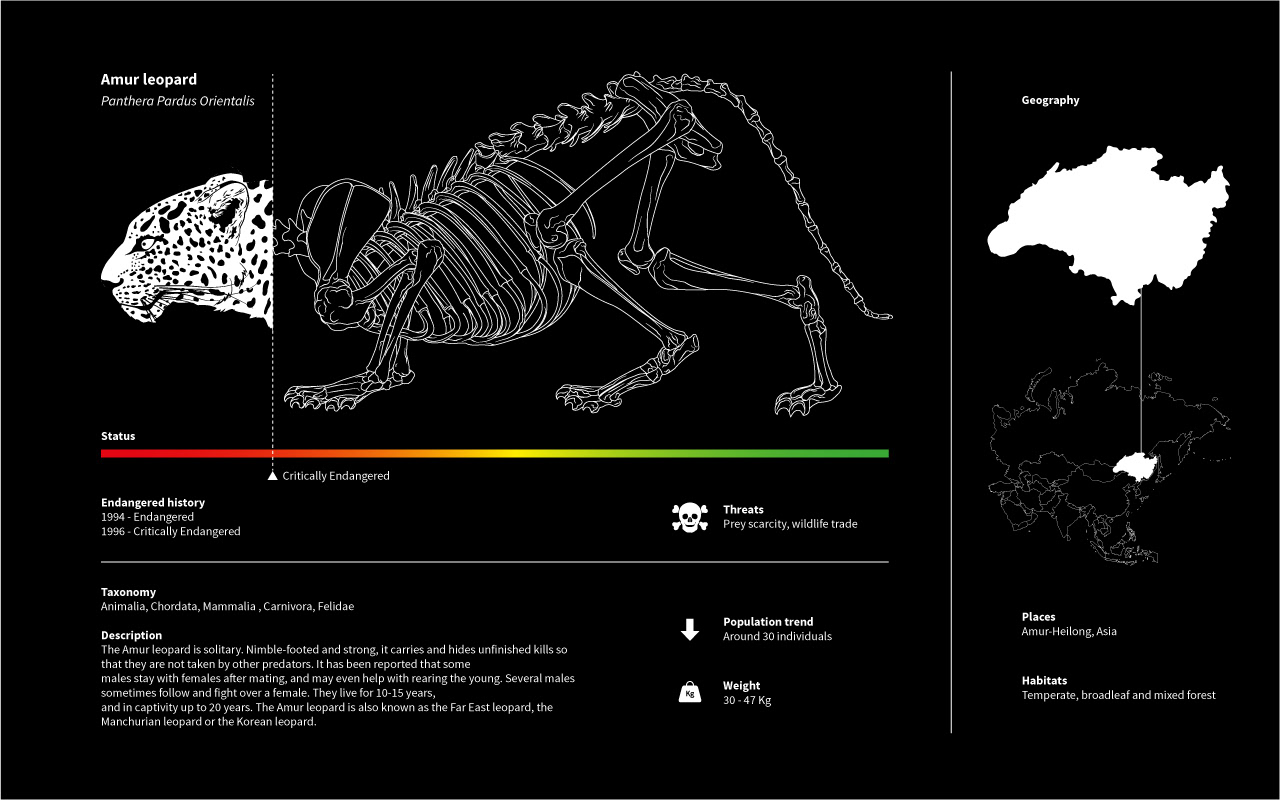
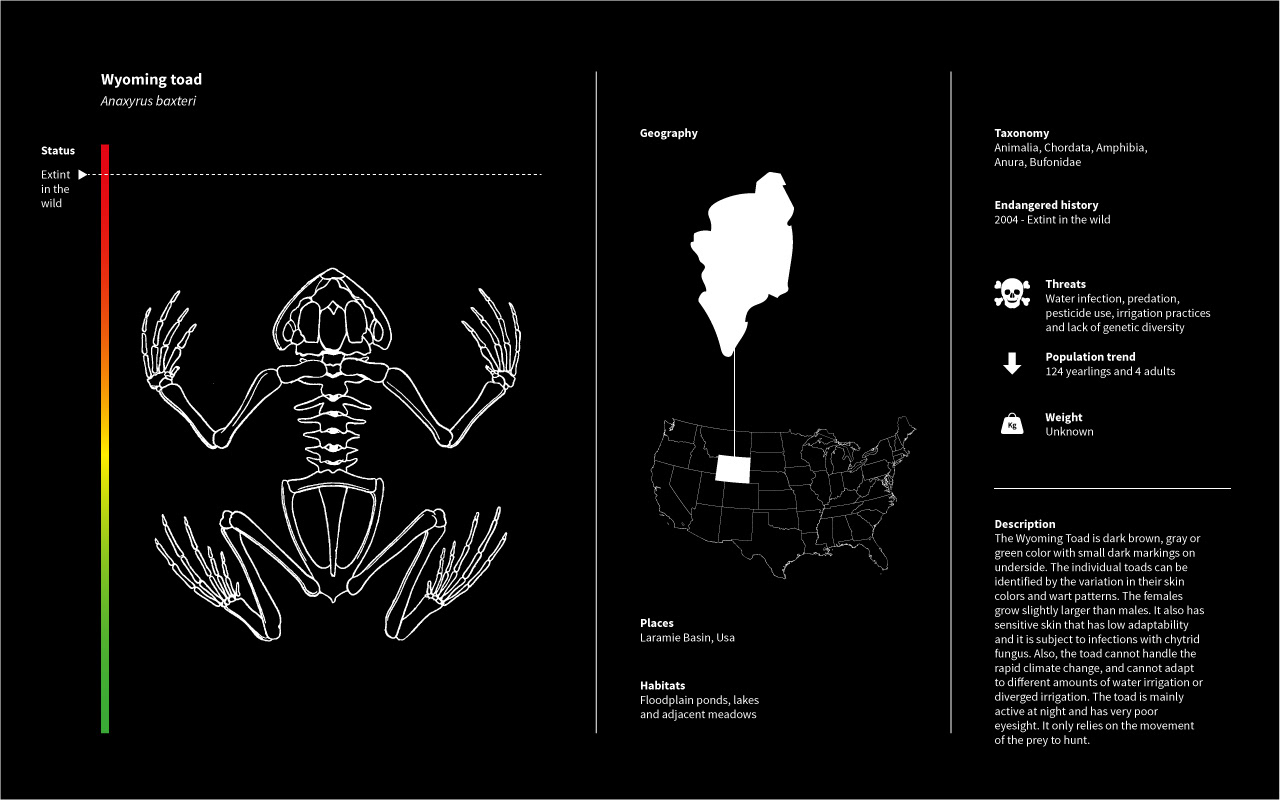
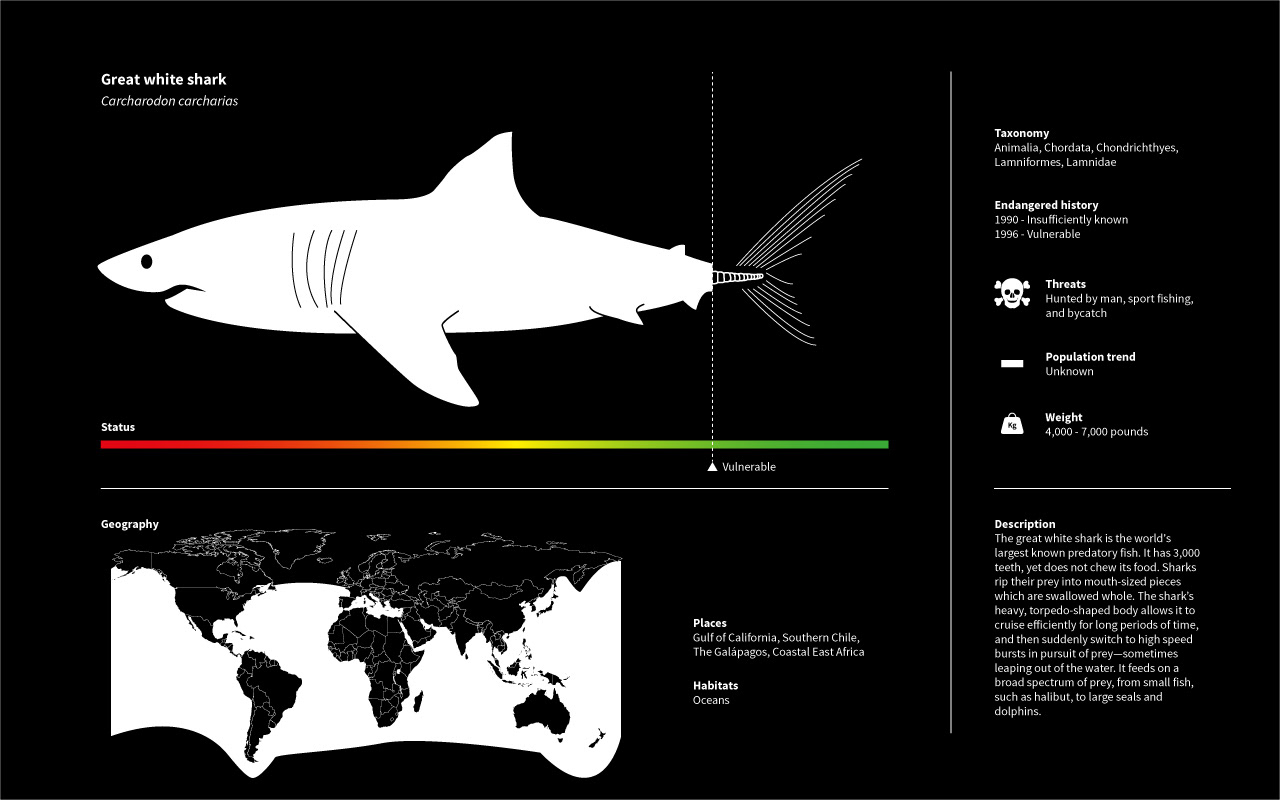
In case of using the mouse, the user can click on the geometrical shape near the animal name and get the additional information on another page (see below the design - not implemented).
In case the navigation happens through the Leap Motion, a Qr-code on the bottom left of the interface give you access to a mobile app with the in-deep information.
In case of using the mouse, the user can click on the geometrical shape near the animal name and get the additional information on another page (see below the design - not implemented).